
Product test
Intel knocks AMD off its throne: Core i9-13900K in test
by Samuel Buchmann

Intel’s cheapest new processor surpasses the costly AMD competition when it comes to gaming. It also puts up a good fight against its older sibling, the i9 from the Intel family, as it stays cooler and is more economical.
Intel has brought a great mid-range processor to the market with the Core i5-13600K. In spite of its comparatively low price, the machine packs a solid performance, particularly in respect of gaming. It also stands up to the pricier AMD Ryzen 7 7700X and allows gameplay with less choppiness. Only in a very few benchmarks does it have to admit defeat. The device stays significantly cooler and eats up less performance than its older sibling, the i9-13900K, which I tested in this article:
Here are all the specs for the Intel Core i5-13600K, as well as its direct competitor and predecessor:
| CPU | Cores/threads | Base/boost clock speed | Base performance | Peak performance | Cache L2 | Cache L2 | Max. RAM performance |
|---|---|---|---|---|---|---|---|
| Core i5-13600K | 14 (6 P cores and 8 E cores) / 20 | 3,5 / 5,1 GHz (P)
2,6 / 3,9 GHz (E) | 125 watts | 181 watts | 20 MB | 24 MB | DDR5-5600
DDR4-3200 |
| Ryzen 7 7700X | 8 / 16 | 4.5 / 5.4 GHz | 105 watts | 142watts | 8+1 MB | 32 MB | DDR5-5200 |
| Core i5-12600K | 10 (6 P cores and 4 E cores) / 12 | 3,7 / 4,9 GHz (P)
2,8 / 3,6 GHz (E) | 125 watts | 150 watts | 9,5 MB | 20 MB | DDR5-4800
DDR4-3200 |
I used the following components for this review:
All components were provided to me by the manufacturers for testing. My colleague Kevin used the same RAM, SSDs, cooling as well as graphics card in his tests of the new AMD processors and the latest Intel generation. These test results serve as comparative data.
I activated XMP in BIOS. Otherwise, I left everything at default.
I was running BIOS version 0502 and Windows 11 at version 21H2 (22000.1098).
Here’s an overview of the different benchmarks:
I ran all benchmarks three times and took the best result. For the games, I used the highest possible presets. Otherwise, I left everything at default except for the resolution.
Cinebench R23 tests how a processor performs when rendering 3D models. The benchmark creates scores for single and multi-core performance from these calculations.
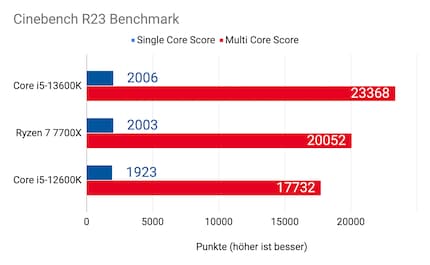
In the benchmark, the 13600K achieved a single core score of 2,006 and a multi-core score of 23,368. It runs at a consistent 5.1 GHz with the performance cores and 3.9 GHz with the efficiency cores. This brings the single-core Intel processor on a par with AMD’s 7700X. In multi-core, it scores 16% more thanks to the four additional threads. Compared to its predecessor, the 12600K has seen a 4% increase in terms of single-core and 32% when it comes to multi-core.
The CPU-Z benchmark tests a processor’s speed in both single and multi-core mode and uses this to calculate a total score.
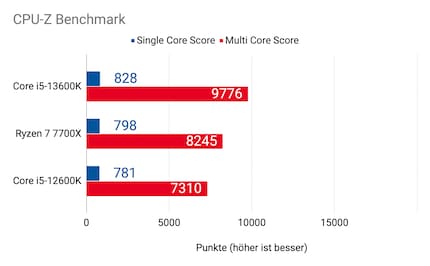
In single-core, the 13600K scores 4% more than the AMD competition and 6% more than the predecessor. In multi-core, the lead over AMD increases to 18% and 34% over the predecessor.
7-Zip’s built-in benchmark tests a system for compressing and decompressing data. From this, it calculates a score in giga instructions per second (GIPS). I chose the default «dictionary size» of 32 megabytes.
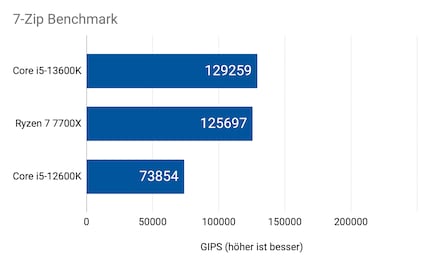
The new Core i5 is also slightly faster in 7-Zip than the Ryzen 7 – scoring as it does 3% more. Compared with the predecessor, it’s even 75% faster.
Blender benchmark renders three scenes in its 3D graphics suite (version 3.3) and calculates three scores using them. I’ve added these up to give end scores for each.
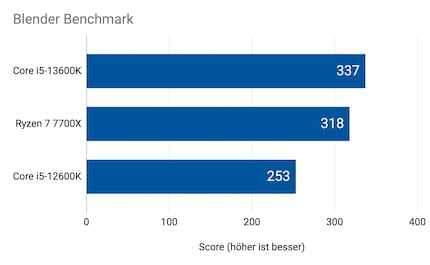
Using Blender, Intel scores 5% better than AMD, and the performance increases by 33% compared with the previous generation.
Using the Photoshop benchmark from Puget Systems, I ran different workloads. You can find more detailed information on that here. At the end, the benchmark calculates a score based on the reference workstation.
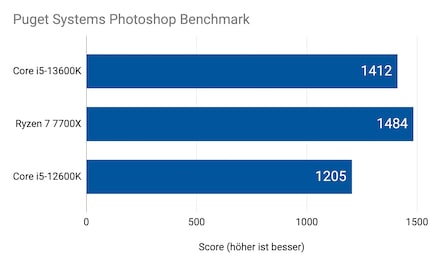
In Photoshop, the 13600K is 5% slower than the 7700X. Compared with its predecessor, the score has increased by 17%.
Using the Premiere benchmark from Puget Systems, I ran different workloads. You can find more detailed information on that here. At the end, the benchmark calculates a score based on the reference workstation.
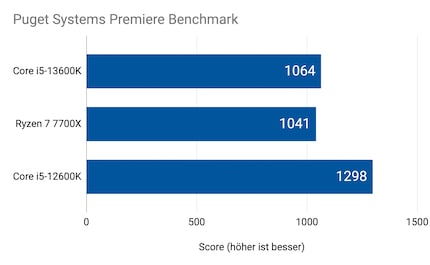
In Premiere, Intel’s new processor is 2% faster than AMD’s 7700X. However, it’s not very meaningful that the score is 18% less than with its predecessor. I suspect that Premiere hasn’t been optimised for the new processors yet. Therefore, this information should be taken with a pinch of salt.
The PCMark 10 benchmark tests diverse scenarios such as app loading times, the efficiency of spreadsheet calculations, web browsing and photo and video editing. In other words, it demonstrates how suited a processor is to office work. From that, it calculates a score.
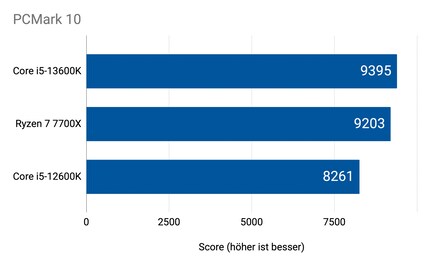
In PCMark, the leading edge over AMD is 2%, while the lead over the latest generation Intel CPU is 16%.
These synthetic game benchmarks provided a first glimpse of in-game performance. I haven’t provided the overall score, which combines graphics card and processor performance. This is because I want to exclude the former from processor reviews.
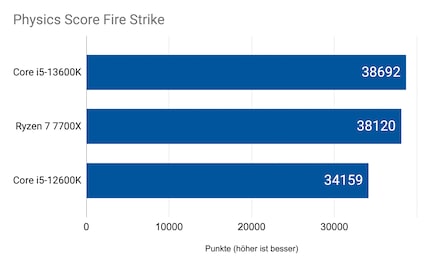
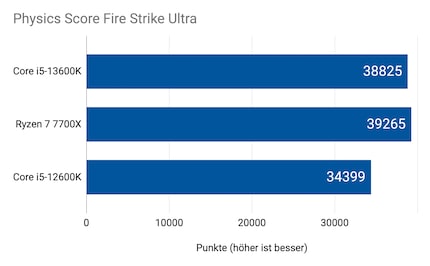
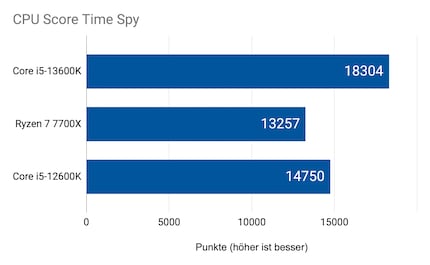
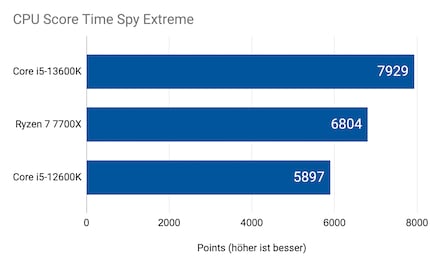
Across all four benchmarks, the 13600K scores 6% higher than the 7700X. But compared to the previous processor, it achieves a noteworthy 16% higher rating across the four benchmarks.
But synthetic benchmarks have limited significance and don’t tell the whole story. What’s more important is how the processor fares in real games.
Since we can’t display image galleries, I won’t list individual game results here. You can download all the benchmarks here. The following graphics show the arithmetic mean of all nine benchmark games. I’m aware that processor performance is mostly only relevant at 1080p and below. Nevertheless, I tested 1080p, 1440p as well as 2160p. My reasoning: you likely won’t buy a latest generation processor and then play in 720p.
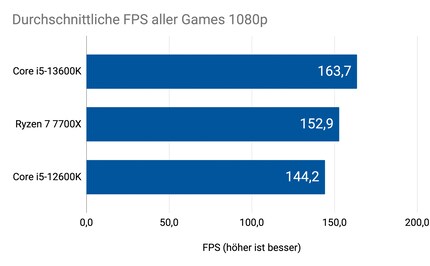
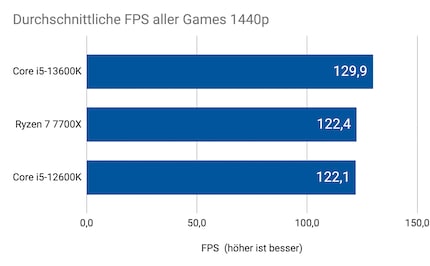
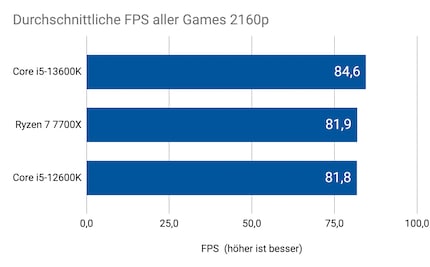
Across all resolutions, the 13600K delivers more FPS than the competition and its predecessor on average. As expected, these differences became smaller at higher resolutions. At 1080p it was 7%, at 1440p 6%, and at 2160p 3% when compared to AMD’s 7700X. Compared with the 12600K, that’s 13%, 6% and 3%.
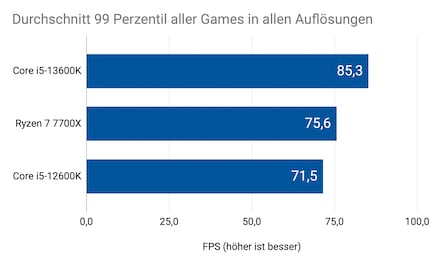
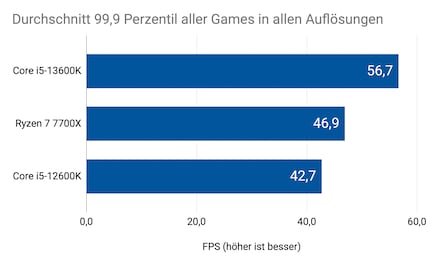
In «Gears 5» and «Shadow of the Tomb Raider», Ryzen 7’s new i5 barely has to admit defeat. And in the other games, it’s streets ahead. Even at 99% and 99.9%, it outpaces AMD competitors and its predecessor. These values show how much games can be affected by choppy video. The arithmetic averages at 99% across all games and all resolutions are 13% higher than with 7700X and 19% higher than with the predecessor. At 99.9%, the margin is as much as 21% and 33%.
In most situations, the 13600K stays relatively cool. When idle, it reaches 35°C and only uses 17 W. Light loads, such as YouTube, add an extra two degrees and three watts. The PCMark test showed the temperature to be 40°C while consuming 32 W. While gaming, these values vary starkly, but are usually in the realm of 40 to 50°C while consuming about 50 W of power. Demanding games, such as Cyberpunk, sometimes also trigger spikes of 58°C at 70 W. It’s only when at full load in the Cinebench test that the 13600K gets warmer. The sensor identifies a maximum of 80°C and 155 W.
This makes Intel’s new mid-range processor efficient when compared with its performance-hungry older sibling, the i9-13900K. Power consumption is in the same range as the AMD Ryzen 7 7700X, although the latter sometimes reaches 95°C at full load.
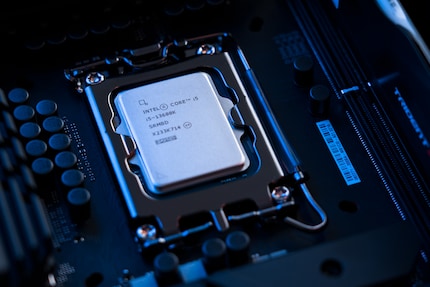
The Intel Core i5-13600K provides a bridge between price and performance. It launched with a moderate price tag of 376 francs. In games, it delivers more than 90% of the performance of its older sibling, the Core i9-13900K for only half the price – all while staying cooler and gobbling up less power. It manages to beat the AMD Ryzen 7 7700X, currently priced at 441 francs, in most games and especially at 99 and 99.9%. In productivity benchmarks, they usually come out head-to-head.
Given that Intel’s Raptor Lake processors still run on the LGA1700 socket and also support DDR4-RAM, the 13600K is predestined for mid-range gaming PCs. The AMD Ryzen 7000s, on the other hand, require a latest generation mainboard and expensive DDR5-RAM for their new AM5 socket. In that respect, the long-term outlook for the Intel socket is worse than for its AMD counterpart. But all this is purely speculation. At the moment, Intel’s Core i5-13600K is the clear winner when it comes to price-performance ratio.
My fingerprint often changes so drastically that my MacBook doesn't recognise it anymore. The reason? If I'm not clinging to a monitor or camera, I'm probably clinging to a rockface by the tips of my fingers.